X-Pinches

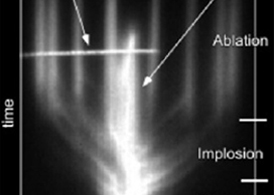
An X-pinch is formed by two or more wires that cross at a single point and is driven by a large current pulse (>80 kA) from a pulsed power device.  The currents through each of the wires of an n-wire X-pinch combine at the cross-point and the magnetic pressure at that location increases as n2 relative to a single wire.  The increased magnetic pressure creates a localized a pinch column (mini z-pinch) approximately 100-400 μm long.  The column undergoes instabilities that cause an implosion of the plasma into small regions of high temperature and density, often referred to as micropinches.  From these regions, one or more micron-scale, sub-nanosecond soft x-ray bursts (1-10 keV) are emitted.

Images of X-Pinch experiments

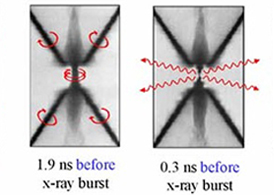
The emission from the center of the X-pinch acts as a near instantaneous (sub-nanosecond) point source (micron-scale).  Such a source can be used for point-projection imaging of objects both static (housefly) or moving (another X-pinch as seen above, or a z-pinch shown below).

Images of an X-pinch

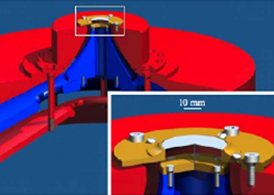
In order to image a z-pinch, the X-pinch must be placed in the return path as illustrated in the diagram below.

The X-pinch is placed in the return path

A new area research involves placing an X-pinch below a z-pinch in order to image the axis of an array as illustrated below.

Placing an X-pinch below a z-pinch in order to image the axis of an array

Wire Arrays

Image of a wire array

Wire Arrays

A majority of the laboratory research effort is focused on wire array z-pinch physics. During the last years, we have shown that wire-array Z-pinch experiments, including on Z at 20 MA, proceed via four distinct phases: plasma initiation by current driven wire explosion, ablation from stationary dense wire cores and redistribution of the array mass by global-field-driven flow of the ablation plasma, snowplow-like implosion of the redistributed mass, and stagnation of the imploding plasma on axis, at which time an intense x-ray pulse is generated. The optical streak camera image shown below illustrates the four phases of wire-array z-pinch dynamics identified above, except that the initiation phase, which takes place close to the beginning of the streak, does not emit enough light to be visible in the streak.

In addition to standard cylindrical wire array loads, several novel configurations have been investigated experimentally, including nested, radial and conical arrays and X-pinches, because they enable detailed measurements of particular aspects of z-pinch physics and extend the available range of plasma parameters and applications. We begin with a discussion of the four phases of cylindrical wire-arrays.

Initiation

At early times, the flow of current through the wires increases their temperature and resistance, melts them and then partially vaporizes and ionizes them, resulting in the formation of coronal plasmas around the wires. The voltage across the wire then abruptly collapses as the current transfers to the coronal plasma and continues to rise. By measuring the load current and voltage, the energy deposited in the wires prior to plasma formation has been measured in both single wire experiments and wire-arrays. For most wires, the wire cores are only partially vaporized, which is consistent with radiographic images showing a foam-like mixture of liquid and vapor states. The energy deposited in the wire cores and their subsequent size has been shown to be sensitive to the wire – electrode contacts and to the polarity and geometry of the electric field. When the current transfers to the coronal plasmas around the wires, the ablation phase is initiated.

Ablation

Since the majority of the current is flowing in the coronal plasma, little force is applied directly to the wire cores, and so they remain stationary. Plasma is ablated from the wire cores by radiation and heat conduction and is driven by the jxB force (j is the current density and B the array magnetic field) towards the array axis, filling the interior of the array. This process is shown in the 150 ps laser image, including “precursor” plasma buildup on axis.

The ablation process is reasonably well described by a rocket model, which argues that the ablation rate is proportional to the JxB force divided by the flow (“ablation”) velocity. Analysis of wire-array z-pinch experiments from 1-20MA has shown that the velocity remains essentially the same despite the huge difference in the driving force. However, the ablation velocity is sensitive to the gap between wires in the array. The wire ablation rate is important in determining the radial distribution of mass at the start of implosion and the sensitivity to magneto-Rayleigh-Taylor (R-T) instabilities. The ablated plasma radial profile converges to an equilibrium that arises as a result of the nature of the MHD equations in cylindrical geometry.

While the above data characterizes the average ablation of the wires, it is clear that the ablated plasma has a strong axial modulation. The corresponding modulation of the ablation rate has been observed in all wire array configurations and provides a seed perturbation for Rayleigh-Taylor instabilities during the implosion phase. Variations in wavelength and amplitude have been characterized experimentally. In recent COBRA experiments, up to five X-pinches emitting x-ray bursts between 70 and 170 ns after the start of the current pulse were used to image W wire arrays.  Three such radiographs from one pulse are shown below.

Graph of core diameter (µm) vs time (ns)
Graph of average ablation of wires
radiographs from one pulse

These radiographs are being used to evaluate quantitatively the temporal and spatial evolution of the ablation plasma, including the axial modulations, in individual pulses. High-resolution 3D MHD simulations are now showing axial modulations that are similar to the observed modulations, suggesting that an MHD instability mode is responsible. Joint experiments with Sandia scientists using chemically etched wires showed that variations in initial wire diameter do not remove the “natural” wavelength of this modulation, but allow introduction of controlled perturbations. The results of these experiments were used to benchmark Sandia’s ALEGRA and the laboratory’s GORGON MHD codes. The only configuration tested so far that eliminates this modulation is the helical wire array, in which the introduction of the axial magnetic field associated with the helical current path appears to lock the modulation wavelength to the period of the helices.

Implosion

This phase of wire-array dynamics begins when ~50% of the initial wire material has been ablated. As plasma is swept up by the implosion “snowplow,” the variation of the ablation rate along the wires provides a large-amplitude seed perturbation for the R-T instability and also results in a fraction of the initial array mass being left behind (as “trailing mass”) by the implosion. The growth of the instability in the implosion surface and evolution of the trailing mass can be seen in the series of XUV images from COBRA shown below.

Series of XUV images showing the growth of the instability in the implosion surface and evolution of the trailing mass

Our investigations showing the importance of the trailing mass are now accepted by the Z-pinch community. he plasma filling the interior of the array is accreted by the implosion surface giving rise to “snowplow” radiation which can be used to tailor the foot of the radiation pulse. laboratory experiments have shown how further control over radiation pulse shaping can be achieved using nested wire arrays in the current transfer mode. Methods to increase the duration of the radiation pulse using zippered implosions in conical wire arrays have also been explored.

Stagnation

The assembly of the imploding plasma on axis leads directly to the first high intensity x-ray pulse, the part of the x-ray output that is important for ICF. Detailed analysis of gated XUV images has shown that the temporal spread in the stagnation of different parts of the plasma structure onto the axis can be directly correlated with the x-ray rise-time. The helical instability visible in the post-stagnation frames like the last one in the above figure may be responsible for the late-time breakup of the z-pinch.
Very careful spectroscopic measurements of gas-puff z-pinches by our Weizmann Institute partner show that the implosion kinetic energy was adequate to explain the radiation pulse. However, in wire-array z-pinches, this may not be so. For example, in experiments with wire arrays in which the current through the stagnated plasma column was held constant but the implosion kinetic energy was changed by a factor of two, the X-ray power was observed to be unchanged. There remains uncertainty over what fraction of the x-ray pulse is generated by the kinetic energy of the implosion versus other mechanisms that might convert magnetic energy into electron thermal energy and radiation, such as turbulence, Ohmic heating or MHD instabilities.

Radial Foils

This research complements the large national and international research program, based on wire array Z-pinches, by conducting an in-depth investigation of radial foil geometries.  By changing the type of material and the geometry of the experimental setup, it is possible to vary the different parameters governing the dynamics of high energy density plasmas in thin radial foil configurations.  We are investigating how plasma dynamics (radiation, magnetically threaded flows and shocks) changes with foil material and electrode geometry.  Particular attention is given to the measurement of magnetic fields and plasma velocity fields.  The information collected can be used to maximize radiation yield, to understand the physics of magnetically threaded astrophysical jets, to mitigate magneto-hydrodynamics instabilities and to validate the theoretical models used in computational codes.
While foils have been extensively used in cylindrical geometries, thermal and striation instabilities were found very strong and the overall foil mass too large to be optimally driven by actual pulsed-power generators. Historically, replacing cylindrical foils by a series of vertical wires was more successful as the Rayleigh-Taylor (RT) instability subsided.  Another major disadvantage of cylindrical foil configurations comes from striation, as the current does not only travel along the vertical direction but also azimuthally.  As a result, current channels can twist and deviate from a vertical path, degrading the quality of the implosion and reducing the radiation yield.
On the other hand, radial foil arrays have two major advantages.  First the current is forced to run towards the axis.  Hence the current density becomes very large at the center of the foil. Consequently, moderate generators can explode radial foils since the mass density of the foil is not as limiting a parameter as in cylindrical geometries.  The other important characteristic comes from the radial geometry.  Since the current path is radial, any twisted current channel at the edge of the foil has to straighten to go through the inner (axial) electrode.  This phenomenon is extremely important since it favors current symmetry. Despite such advantages, radial foil physics is still largely unexplored.The experimental setup is described in the illustrations on this page.

Cut away view of the three-dimensional model representing the experimental radial foil setup, mounted on the anode and cathode of COBRa. An inset shows a larger view of the actual layout.
Above: Cut-away view of the three-dimensional model representing the experimental radial foil setup, mounted on the anode (A) and cathode (K) of COBRA. The inset shows a larger view of the actual layout.
Schematic drawing of currents, magnetic fields and force distribution
Above: Schematic drawing of currents, magnetic fields and force distribution.
A laser shadowgraph taken 65 ns after the start of the current rise shows the actual setup with then cathode at the bottom of the image.

Above: A laser shadowgraph taken 65 ns after the start of the current rise shows the actual setup with then cathode at the bottom of the image. The large horizontal dark band in the bottom half of the picture is the shadow of the foil holder. The foil is located above. Foil lift, surface plasma and miniature Bdot probes are clearly visible.