XP

The XP user is a low impedance generator that is capable of delivering 500 kA to the load with a 50 ns rise time.  The XP generator uses a four-stage current amplification process to create the desired pulse shape.  The energy delivered to the load is initially stored in a Marx generator followed by an intermediate storage capacitor and pulse forming line and finally a water-vacuum interface to deliver the current to the load.

The Marx generator consists of ten 1.8 μF capacitors typically charged in parallel to 42 kV each for a total of about 16 kJ.  The capacitors are discharged in series through spark gap switches to the intermediate storage capacitor (ISC) which has a total capacitance of 80 nF.  The ISC charges for about 900 ns before it is discharged through an SF6 filled self-breaking spark gap switch into the pulse forming line (PFL) which has a total capacitance of 34 nF.  The PFL charges for about 180 ns before it is discharged through 8 parallel water gap switches into the water-vacuum interface and the load region, delivering 500 kA in 50 ns.

Diagnostics available on XP:

  • PCDs, Si diodes, and XRDs
  • 3 Channels of shadowgraphy and interferometry
  • FSSR
  • Pinhole cameras
  • Visible spectrometer
  • ISC voltage, PFL voltage, and Load current monitors

COBRA

The COBRA pulsed power generator is a low-impedance 0.5 ohm pulse generator for high energy density (HED) plasma research. COBRA was designed to drive loads of order 10 nH to a nominal 1 MA. The design allows the operator to choose among a variety of current waveforms with zero-to-peak rise times in the range of 95–230 ns, and full width at half maximum of ~300 ns. Since COBRA is intended for a variety of different HED experiments such as gas-puff z-pinches, wire-array Z pinches, X pinches, and conical wire arrays for jet production, and is available to external as well as internal users, this pulse shape flexibility is an important and unique feature.

The diagnostic set on COBRA includes a 10 J Thomson Scattering diagnostic for electron and ion temperature and plasma flow velocity measurements, multiple interferometry channels for plasma density measurements, gated visible light and extreme ultraviolet multi-frame cameras, a visible light streak camera, several visible light spectrometers, a time-integrated soft X-ray spectrometer, time-resolved X-ray instrumentation, and others.  The necessary digital data acquisition systems for all of these diagnostics are also available.  

The primary application of COBRA is to drive wire array Z pinches. To facilitate use of these loads, the final vacuum power feed, and the load are oriented with a vertical axis. A clear diagnostic line of sight is preserved through the vertical axis, and the pulsed power is also configured to leave the equatorial (horizontal) plane unencumbered to allow maximum diagnostic access and easy experimenter access to the load vacuum chamber.

The generator is composed of four identical coaxial water dielectric pulse-forming lines (PFLs) 1.8 ohm, 30 ns long). The primary energy storage is a pair of 16×1.35 μF Marx generators charged to 70 kV. Each Marx charges a water dielectric, 46 nF intermediate storage capacitor. Each intermediate storage capacitor is switched out at about 800 ns for maximum forward energy transfer through a self-breaking sas switch (referred to as the “main” switch). Each intermediate store then charges a pair of the PFLs in 300 ns. Adjustment of the two main switch pressures can be used to synchronize or to intentionally offset the initiation of charging of the two pairs of PFLs. The four PFLs are independently switched into a current adder section by four laser triggered gas switches. To reduce prepulse load voltage to a very low level, these four output switches are oil-insulated to reduce shunt capacitance.

The connection of the output switches to the triplate and the vacuum interface.

The current adder section is a triplate transmission line in water, with an optimized capacitance to peak the rate of rise of current. This peaking capacitance is required as a result of the relatively high inductance of the output gas switches. The four output switches are connected at symmetric points around the circumference of this circular adder line. The triplate passes radially through a six-ring (Rexolite) 45° graded interface into vacuum, and uses a vacuum post hole convolute to make the transition to the final coaxial feed to the load. The figure below shows the connection of the output switches to the triplate and the vacuum interface.

The vacuum section inside the interface, with the triplate, the convolute, and the final coaxial power feed to the load.

The vacuum section inside the interface, with the triplate, the convolute, and the final coaxial power feed to the load.

The COBRA configuration, based on the addition of four independently switched current sources.

The COBRA configuration, based on the addition of four independently switched current sources, allows considerable variation in the load current pulse shape. The four output switches are triggered by dividing a 5 ns, 100 mJ pulse of 266 nm light from a quadrupled Nd:Yttrium aluminum garnet laser into four beams, and choosing relative optical delays to the four switches to give the desired timing. The switches are adapted from a standard “Rimfire” multichannel switch design3 developed at Sandia National Laboratories. The triggering laser beam enters the switch axially . With this laser, the COBRA switches can be triggered at 80% or more of self-break voltage with closure time of 18–22 ns. At 70% of self-break voltage, closure time is 24–30 ns. Triggering is successful down to about 60% of self-break but with longer and more variable closure times, and below 60% it is unreliable. These output switches can also be operated without the laser in a self-breaking mode with reduced flexibility in the pulse shape.

Spectrometers

To study the load plasma parameters and structure of the imploded loads, a set of crystal spectrographs with spatial resolution and high luminosity have been used, including a focusing spectrograph with spatial resolution (FSSR) with a spherical mica crystal and the extreme luminosity imaging conical spectrograph (ELICS) with a conical mica crystal. 

Spectrographs

The main features and characteristics of the spectrographs used are described below.
TypeCrystalSpatial resolutionMagnification
FlatKAP~100 µm slit~0.5-1
ConvexMica100-200 µm slit~0.3-1
FSSR, spherical
R=186 mm
Mica150 µm0.2
ELICS, conicalMica50 µm0.5

 
Examples of spectra obtained with the FSSR for two different current pulses, one with 1 MA peak current and 100 ns rise time (0 to peak), and the other with 850 kA peak current and 150 ns rise time,
Examples of spectra obtained with the FSSR for two different current pulses, one with 1 MA peak current and 100 ns rise time (0 to peak), and the other with 850 kA peak current and 150 ns rise time, are shown in this figure. The spectra show significant difference in the imploded array morphology,especially the bright spot structure.

Streak Camera

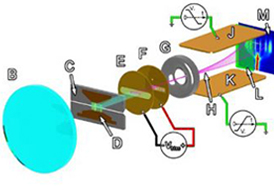
Two streak cameras are available on COBRA. One is a Hamamatsu visible-light streak camera and the other is a Kentech x-ray streak camera. Both work fundamentally the same—i.e., they both “streak” a single dimension of incident photon intensity as a continuous function of time. This single dimension can, for example, be either a spatial dimension (as in a dynamics study) or a wavelength dimension (as in a spectroscopic study). Photons from the single dimension chosen must be incident on the entrance slit of the given streak camera. In the case of the visible light streak camera, the photons are imaged onto the entrance slit and this image is then transferred by the camera’s internal relay optics to a photocathode. In the case of the x-ray streak camera, the x-rays are transmitted directly to the photocathode (without imaging) through a cross slit. For both cameras, the photons reaching the photocathode are converted to electrons via the photoelectric effect. These electrons are accelerated longitudinally within the streak camera by a biases grid. At the end of this longitudinal acceleration, the electrons are focused by an electrostatic lens.

After the electrons have been accelerated longitudinally and focused, they are deflected laterally by a time-varying transverse electric field. This field is created by discharging a bias potential across two plates (one plate on each side of the electron stream). This effectively paints the electron stream onto the phosphor screen in a single sweeping motion (similar to a cathode-ray tube television). The phosphorescence from the phosphor screen is then recorded by film or a digital CCD camera, or it is further intensified by use of a micro-channel plate (MCP). The visible streak system on COBRA, for example, uses an MCP to intensify the streak camera’s phosphor image, and then digitally records the luminescence from the MCP’s phosphor screen via a CCD camera. The digital image is then easily viewable with varying contrast using Hamamatsu’s pre-packaged image software, as well as easily saved for post-processing.

The transverse bias voltage versus time waveform in a streak camera is a non-linear “S” curve. Thus one only uses the approximately linear region in the middle of this curve as the streak time window so that there is a linear relationship between a position in an image and the time of that position. Also, varying streak speeds and time windows can be obtained by making adjustments to this discharge waveform (this is automated for the visible streak camera by the Hamamatsu software, but must be done manually for the x-ray streak camera). The time resolution of a streak image depends on the streak speed, the input slit width, and the streak camera’s internal magnification. For example, if an instantaneous flash of light occurs during a streak, then an image of the input slit will be produced at that particular moment in time. This flashed slit image will then take up some finite fraction of the total streak image in the time direction (based on the slit width and the internal magnification within the streak camera). In other words, if the streak window is 100 ns, and a flashed slit image takes up 5% of the total streak image in the time direction, then the time resolution is 5 ns.

It should also be mentioned that the visible light streak camera can be put into “live mode” (also known as “focus mode”), which allows an experimenter the ability to make optical alignment and focusing adjustments to their system while continually monitoring the effects of those adjustments. Live mode is a system state where the streak camera has no transverse bias potential applied. Thus the electrons stream straight through to the phosphor screen, producing a stationary image of the streak camera input slit (i.e., with a small slit width, live mode will result in a thin horizontal line across the middle of the image). To allow the nearly real-time adjustment-monitoring capability, the system’s CCD camera continually takes pictures and sends them to the system’s PC. The PC then continually updates the image on the computer monitor with the most current one taken by the CCD camera (the image is usually updated every half second or so). Also, by opening the slit wide (i.e., on the order of millimeters), 2D imaging can be accomplished in live mode, which helps when trying to focus an image onto the input slit/plane of the streak camera as well as when trying to align a particular part of an object’s image onto the input slit.

Graphic of a generic visible light streak system illustrating the working principles.

Graphic of a generic visible light streak system illustrating the working principles. The components are:

A. Wire-array z-pinch load (Usually the self emission from the wire plasma is the source of visible light.)
B. Optical relay lens (This could be a system of relay optics.)
C. Streak camera entrance slit
D. Image of wire-array and load region at the entrance slit
E. Electron0emitting photocathode
F. Electron-accelerating grid
G. Electrostatic lens
H. Electron trajectories
J. Upper sweep bias plate
K. Lower sweep bias plate
L. Phosphor screen
M. Detector (film, CCD camera, etc.)

Figure courtesy of J. D. Douglass

XUV Cameras

During our experiments we have developed a number of diagnostics, one of the most useful of which are XUV (extreme-ultraviolet, light with a photon energy of (10–100 eV) imaging cameras. Optical techniques, such as laser interferometry and shadowgraphy, are limited by the high density, temperature, and turbulence of plasma in arrays.Typically absorption and refraction effects mean quantitative information can only be gathered on the coronal plasma in the region between the wire cores and the array axis, where electron densities are 1018 cm−3. Conversely, more usual x-ray imaging techniques, such as time integrated/resolved pin-hole cameras, mainly provide information on plasma at the axis of the array—either the precursor column or the plasma at stagnation of the array—where temperatures are relatively high (100 eV). To gain information on the wire cores during ablation, x-ray radiography has been used, with an X-pinch providing probing radiation. This has resulted in measurements of the size of the wire cores, but the hardness of the probing radiation means that information on any core-corona interactions is difficult to obtain due to a lack of contrast. In addition, the time of probing is extremely difficult to control using X-pinches. Although a very simple technique, the application of XUV imaging to wire array experiments can provide significant information on all plasma dynamics. XUV imaging allows the ablation of plasma in a region very close to the wire cores to be directly studied. It also allows the entire implosion of an array to be followed, perhaps indicating the path of current in the system and the amount of any material left behind—both vital factors in determining the characteristics of the x-ray pulse.

Microchannel plates (MCPs)  have a resolution of ,70 mm, and is capable of imaging radiation from  7 eV upward. The MCPs are divided into four independent gated areas, and four pinholes, mounted on a central late, image the pinch onto each “frame,” of the detector. The power supply to the MCP produces a gate voltage of up to 12 kV with a gate time of ,2 ns or greater, determined via a simple cable reflection. The length of cable from the power supply to each frame on the MCP controls the interframe time–low attenuation RM43 coax allows times of .30 ns with a minimal loss of gating voltage (,20% between frames 1 and 4). Two different XUV cameras are commonly fielded on MAGPIE and COBRA. A system with p=75.5 cm and q=41 cm, results in a magnification of 0.54, which allows the entire array to be viewed on each frame of the MCP. Using a pinhole of 100 mm diameter the smallest object size resolvable due to diffraction becomes comparable to that due to geometry (>280 mm) for incident radiation .40 eV. The entire history of the array, from initial wire ablation, through snowplough implosion until stagnation, can be followed by this arrangement. A second system with p=23 cm, q=96 cm, and  again 100 mm produces a magnification of 4.3, and diffraction effects become comparable to geometry effects ,120 mmd when incident radiation is .30 eV. With this higher magnification, an additional set of apertures is required to prevent overlapping of the images on the MCP. This camera is used to study the coronal plasma ablating from the wire cores as shown.

XUV Cameras
XUV Camera image

Laser Backlighter

Laser Backlighter Image
Laser Backlighter Image 02

On COBRA, three Canon digital EOS cameras with high resolution CCD chips, are used in conjunction with a frequency-doubled Nd:YAG laser (532 nm) to produce 150-ps time-resolved laser shadowgraph images. The main beam of the laser source is split into three channels to provide various frame times (about 10 ns between frames). This is accomplished simply by varying the path lengths of the three beams prior to their passage through the experiment chamber. The images produced are due to a Schlieren-like process, where parts of the imaging beam are refracted by density gradients in the plasma. The rays that are refracted only slightly by relatively mild density gradients are collected and focused by imaging optics, while rays that are refracted to larger angles by sharper density gradients are scattered out of the collection cone of the imaging optics. This process is not properly called Schlieren imaging, however, as there is no beam stop at the focal point of the unperturbed rays. Also, it should be mentioned that complete reflection of an imaging photon will occur wherever the plasma density is high enough such that the electron plasma frequency exceeds the laser frequency. As the frequency of a 532-nm laser is 5.6×10¹⁴ Hz, the corresponding electron density is 3.9×10²¹/cm3. The non-uniform plasma stagnating on the array axis in a wire-array z-pinch experiment can exceed this cutoff density, but only in some small localized regions. Therefore any contribution to the shadow image from this mechanism is most likely very small compared to that caused by refraction. From these images, it is difficult to obtain quantitative information about actual plasma state parameters such as density. This is because a given ray may actually refract multiple times due to interactions with various density gradients as it traverses the plasma. It is then difficult, if not impossible, to unfold this history from the net refraction. On the flip side, these images do provide a qualitatively valuable picture of what is going on with the bulk mass of the plasma. Also, some geometrical quantities, such as implosion convergence ratios, axial periodicity of ablation streams, and the size of implosion bubbles can be determined.

Interferometer

Interferometer in action during the explosion of a radial foil

COBRA is equipped with both Mach-Zehnder and shearing interferometers. This picture is the interferometer in action during the explosion of a radial foil.